
Chapter 1 — full chapter
Chapter 1 — full chapter
Tool — systems mapping
Systems mapping visualizes the broader network around a product, highlighting actors, processes, infrastructure, and relationships that enable circularity. Instead of focusing solely on material or the final garment, it considers fiber producers, yarn suppliers, fabric manufacturers, dyeing and finishing facilities, garment makers, brands, users, repair services, resale platforms, collectors, sorters, and recyclers. This tool is vital because many barriers to circularity are systemic. A garment may be technically recyclable, but without a collection system, sorting infrastructure, or recycling partners, that route is unrealistic. Similarly, repairability depends on spare parts, repair knowledge, customer access, and affordable business models. Systems mapping shows that circularity relies on collaboration across the entire value chain, not just on design. It can be used as a visual strategy tool to redesign traditional linear value chains into interconnected, circular ecosystems.
The recommended systems mapping toolkit is developed by H&M foundation and can be found here: https://hmfoundation.com/system-map-toolkit-and-guiding-material/
How to read the map
The System Map combines three layers:
- Value chain: the main stages from fibre production to consumption and end of use.
- Carbon emissions: indicative emissions across different stages, highlighting hotspots.
- Systemic forces: wider influences such as power structures, cultural norms and economic incentives.
The map also shows key actors, leverage points and colour-coded flows connecting different parts of the system, including regulation, capital, innovation and demand.
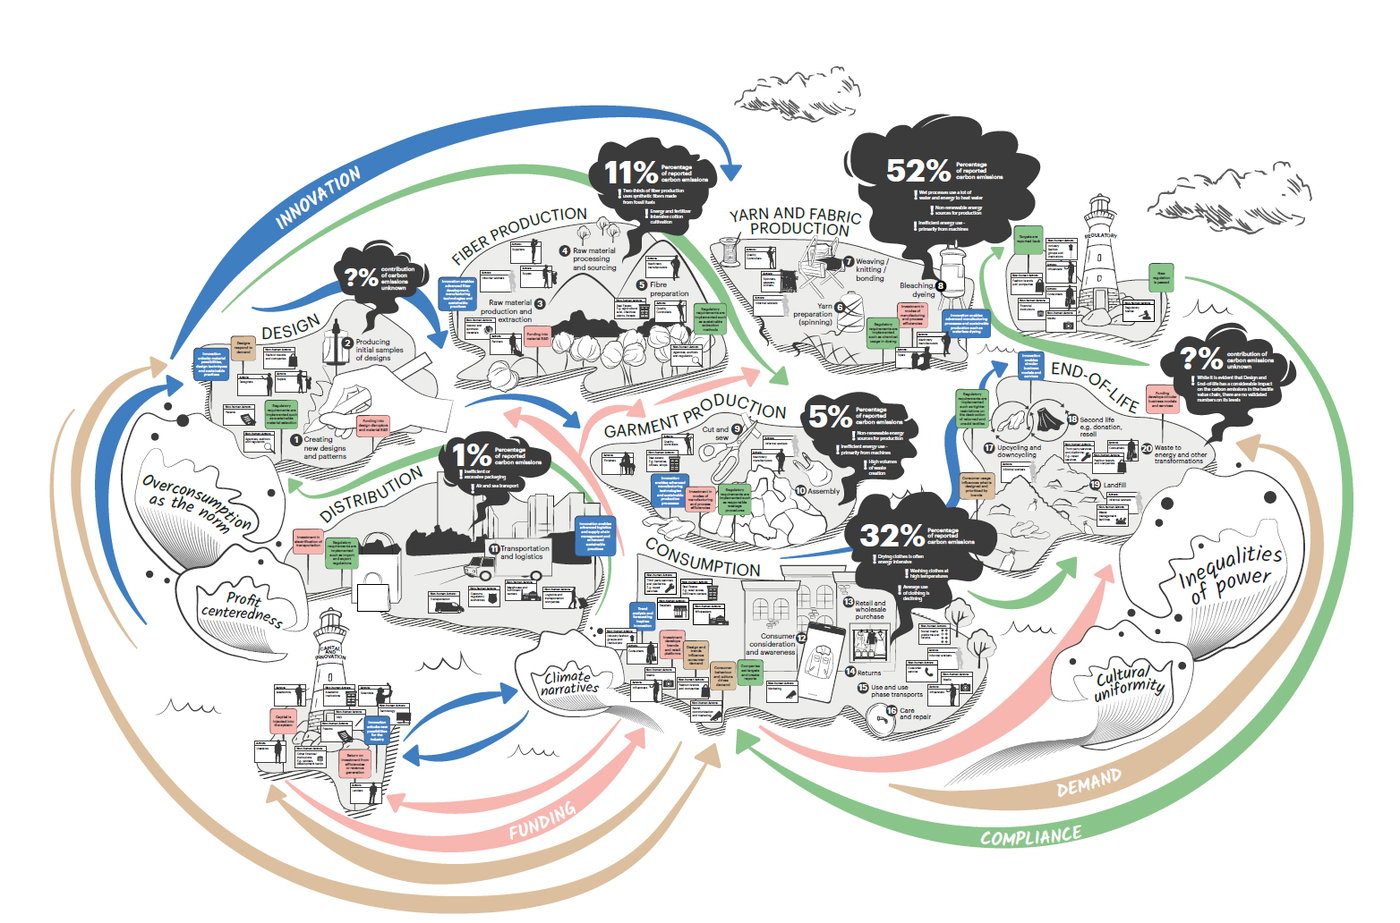
Figure 1.2 H&M Foundation System Map Toolkit. Copyright H&M Foundation. Source: https://hmfoundation.com/system-map-toolkit-and-guiding-material/