Chapter 6 — full chapter
| Site: | FashionKIC Learning Platform |
| Course: | Digital Tools and AI for Sustainable Fashion |
| Book: | Chapter 6 — full chapter |
| Printed by: | Guest user |
| Date: | Sunday, 1 November 2026, 3:20 AM |
6.1 Life-Cycle Assessment and Eco-Labels
Every environmental claim a brand makes rests on a calculation someone performed, and life-cycle assessment is the method by which that calculation becomes defensible rather than rhetorical. Its discipline lies in the boundaries: what is counted, over which life stages, against which functional unit, and with which allocation rules. Two studies of the same garment can differ by a factor of several and both be correct under ISO 14040 and 14044, because they answered different questions. This is why a number without its method is not evidence.
This section takes the reporting angle rather than the laboratory one. It covers the software ecosystem that produces LCA results, the corporate layer that consumes them under the CSRD and its revised scope, and the chain that runs from a full study to a partial footprint to a label on a garment. That chain is where credibility is most often lost, since each step compresses the result further, and a label answers only the question it was designed to answer.
6.1.1 Measuring Impact by the Book: LCA under ISO 14040/14044
CROSS-MODULE REFERENCE : the four ISO 14040/14044 phases (goal and scope, functional unit, inventory analysis, impact assessment, interpretation) and the hands-on openLCA lab are taught in the Sustainable Materials and Processes module, Chapter 6.3, and are not duplicated here, this chapter keeps the reporting and tool-selection angle.
Above the product-level LCA sits company-level reporting: the EU Corporate Sustainability Reporting Directive (CSRD), with the European Sustainability Reporting Standards (ESRS), requires large companies to report audited environmental and social data, with product LCAs, energy monitoring (ISO 50001), and EMS data (ISO 14001) as the operational feedstock.
Reporting scope update (2025–2026). The EU "Omnibus I" simplification package, finalized in December 2025, narrowed CSRD scope to companies with more than 1,000 employees and over €450 million turnover; companies that reported for FY2024 but fall out of scope receive a transition exemption for FY2025–26. EFRAG delivered a simplified ESRS in December 2025, cutting mandatory data points, and the planned sector-specific standards for textiles will be voluntary. For most TCLF SMEs, the practical consequence is indirect reporting: they fall outside CSRD but must supply data, footprints, certificates, traceability records, to the large customers who remain in scope (European Commission, 2025; Deloitte, 2026; White & Case, 2025; EU Textiles Ecosystem Platform, 2026).
6.1.2 From LCA to Label: Turning Impact Data into Credible Claims
Between a full LCA study and a consumer-facing claim sit several intermediate formats. Partial footprints quantify a single impact type: the Carbon Footprint (CFP, kg CO₂e per functional unit), the Water Footprint (WFP, ISO 14046, distinguishing blue, green and grey water) and the Chemical Footprint (CHFP). They are cheaper to produce and easier to communicate than a full LCA, but they invite burden-shifting: a cotton T-shirt (CFP ≈ 2.5 kg CO₂e; WFP ≈ 2,600 L) and a polyester T-shirt (CFP ≈ 5.5 kg CO₂e; WFP ≈ 500 L) rank oppositely on the two indicators, a single-number comparison is meaningless without stating which impact matters where. Environmental labels are classified by ISO into three types. Type I (ISO 14024): third-party-verified labels against predefined criteria, EU Ecolabel[51], GOTS[52]. Type II (ISO 14021): self-declared claims by the manufacturer ("recyclable", "biodegradable") with no independent verification, the natural habitat of greenwashing. Type III (ISO 14025): Environmental Product Declarations (EPDs), quantified, LCA-based, independently verified datasets intended for product comparison rather than marketing. The informational value of labels varies enormously: GOTS covers environmental and social criteria across the lifecycle; OCS certifies only organic fiber content; OEKO-TEX® Standard 100[53] certifies only consumer safety; BCI expresses support for an initiative rather than product properties. A label answers only the question it was designed to answer. The EU's response to this fragmentation is the Product Environmental Footprint (PEF): a standardized, multi-category LCA methodology intended to make environmental claims comparable and to underpin future regulation of green claims.
In May 2025, the European Commission approved the Product Environmental Footprint Category Rules (PEFCR) for Apparel and Footwear, version 3.1, the first standardized EU method for measuring the lifecycle environmental impact of clothing and shoes. It covers 13 product categories (T-shirts, dresses, boots, swimwear and others) with tailored rules, integrates recycled content, durability and repairability parameters, and is voluntary but recommended as the basis for substantiating environmental claims; methodology updates are planned for 2026 and a new supporting database for 2027–2028 (European Commission, 2025; SGS, 2025; UKFT, 2025).
6.1.3 Case example: Asket, the Impact Receipt
Asket[50], the Swedish menswear brand, turns life-cycle assessment into a consumer-facing label. For every garment it publishes an "Impact Receipt" that reports the product's climate, water and energy footprint and breaks it down across the life-cycle stages, raw material, spinning, fabric production, confection, trims and transport, instead of collapsing it into a single opaque figure. The numbers come from a full cradle-to-grave LCA that Asket built over roughly two years with RI.SE[54] (the Research Institutes of Sweden) and, more recently, the impact-data platform Vaayu, giving the disclosure the methodological backing that separates a credible claim from a marketing one. Paired with the brand's "no discounts, buy less" positioning, the receipt turns the abstract map of the value chain into a per-product data statement, the same logic that the EU Product Environmental Footprint and the Digital Product Passport are moving from voluntary gesture to requirement, and a clear European counterpart to per-product footprint labels elsewhere (Asket, asket.com; RISE; Vaayu).
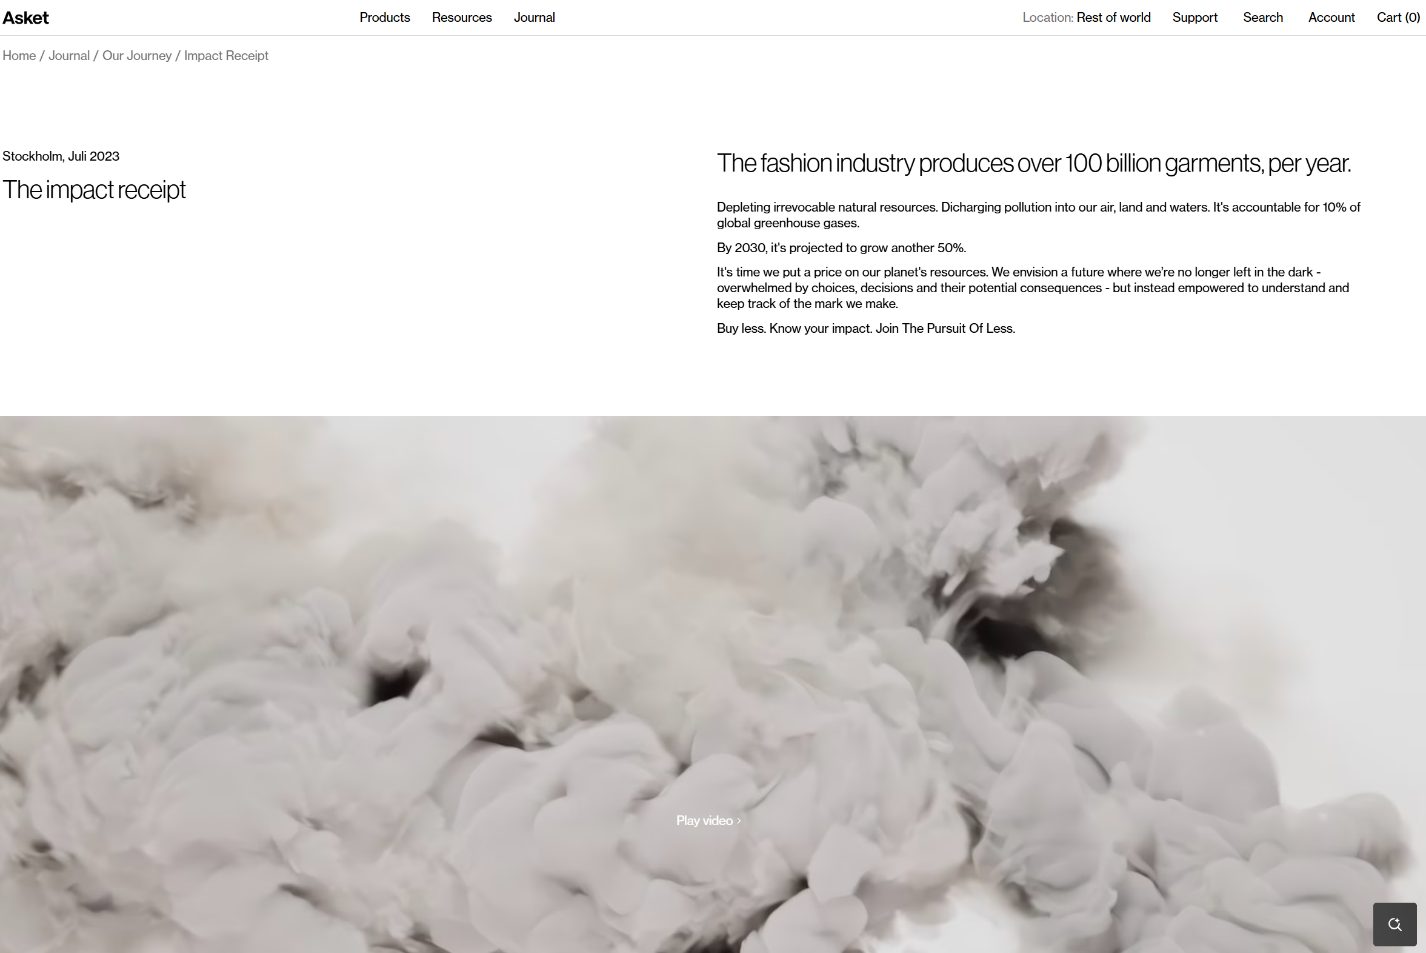
Figure 6.1, Asket's 'Impact Receipt': the per-product climate, water and energy footprint published for every garment. (Source: asket.com)
6.1.4 The Digital Sustainability Reporting Stack
Sustainability reporting is now a software category. Footprint platforms such as Carbonfact and Vaayu compute product-level carbon, water, and energy data across whole ranges, using AI-assisted data mapping and large emission-factor libraries instead of a bespoke LCA per SKU. Higg tools (Cascale) remain the shared material-benchmarking layer, accessed through Worldly; NEMO-style data services and PEF/EPD providers supply the verified datasets that feed corporate disclosures, Eco-Scores and Digital Product Passports. For an SME, the practical question is not which tool is “best” but which one integrates with data the company already holds, bills of materials, purchase orders, supplier certificates, and speaks the reporting language its customers require (PEF, EPD, CSRD/ESRS).
6.1.5 AI-Assisted Footprint Estimation
AI-assisted tools estimate a product’s footprint from inputs such as fiber mix, weight, country of manufacture and logistics route, without running a full ISO 14040/44 study. That is good enough for range-level prioritization, hotspot screening and early design choices, where speed and coverage beat precision. It is not enough when the number will be verified, compared or disclosed: PEF and EPD claims still require a compliant LCA. Use AI estimates to decide where to invest, then commission the full study where the claim matters, the method itself is taught in the Sustainable Materials and Processes module (Ch6.3).
6.1.6 Impact Dashboards and Data Storytelling
Footprint data earns its value in the dashboard. KPI dashboards for sustainability teams track carbon, water, waste and circularity over time and across ranges, turning LCA results into management decisions. The credibility rule for any externally published number: state the method, the scope and the data vintage. How to frame sustainability figures for consumers and stakeholders without greenwashing is taught in the Sustainability Communication and Marketing module, Chapter 1.
6.2 Traceability: Unique IDs, the Digital Product Passport and Blockchain
Circularity begins with identification: a product that can state its own identity can be tracked, verified, resold, and sorted. This section covers the data carriers and identification standards that connect a physical garment to its digital record, and the platforms where that record is assembled before it reaches anyone. The direction is no longer speculative. In the Global Fashion Agenda's 2024 monitoring, 66% of surveyed companies reported value-chain transparency targets, a 39% increase on the previous year, and 62% of those reported progress against them, with the acceleration attributed to CSRD and CSDDD pressure and to the arrival of product passports (Global Fashion Agenda, GFA Monitor Update 2024, https://globalfashionagenda.org). For an SME, the entry point is item-level identification, not a platform.
6.2.1 Giving Products a Voice: QR, RFID, and Unique IDs
A label states a fact; a data carrier addresses a record. That is the whole difference, and it is what makes identification the precondition for everything else in this chapter: a fixed claim printed on a care label cannot be updated, verified, or read by a sorting machine, while a pointer to a record can be all three. The carrier itself is a choice between a printed QR code, cheap and readable by any phone but dependent on an intact surface, and RFID or NFC, more expensive but machine-readable in bulk and without line of sight, which is what makes it the carrier of choice where automated handling is involved.
What keeps these carriers from fragmenting into proprietary systems is the identification standard beneath them. GS1 Digital Link encodes the GTIN together with serial or batch data in a single 2D barcode, so the same symbol scans at the point of sale and resolves online to product information, certifications, and traceability records (GS1, https://www.gs1.org/standards/gs1-digital-link). It is the backbone of the retail migration to 2D barcodes, and its practical consequence is that a brand does not choose between a commercial barcode and a passport link. They are the same symbol.
6.2.2 Case example: H&M, RFID as infrastructure
H&M[11], operating over 5,000 stores, struggled with inventory accuracy: manual counts took weeks per store, and error rates ran at 15–25%. RFID tags applied to each garment at the manufacturing stage, read by fixed and handheld readers across warehouses and stores, raised inventory accuracy from about 75% to over 99% and cut counting time from weeks to hours. The I4.0 benefit is efficiency; the I5.0 significance is that the same item-level identification infrastructure is exactly what product passports, take-back schemes, and automated end-of-life sorting will require.

Figure 6.2, H&M's item-level RFID: tagging every garment lifted inventory accuracy toward real time across 5,000+ stores. (Source: H&M)
6.2.3 A Product That Carries Its Own Record: Blockchain and the DPP
The Digital Product Passport, established under the ESPR (Regulation (EU) 2024/1781), is a structured digital record accompanying a product through its lifecycle: precise material composition, chemicals of concern, origin and supply chain steps, care and repair information, and end-of-life options, accessible through the product's data carrier. Its systemic value is interoperability. The same verified data serves consumers making a purchase, authorities checking compliance against REACH or ecodesign thresholds, resellers authenticating an item and grading its condition, and recyclers sorting by verified composition (section 6.3).
The rules are not yet written. The ESPR is in force, but the obligations that will apply to textiles arrive through a delegated act, currently expected to be adopted around 2027 with application following after a transition period, so design decisions taken now will be governed by requirements that are still being specified. What exists already is the preparatory infrastructure. The EU-funded CIRPASS project produced the cross-sectoral DPP data model and product-identification requirements, together with sector roadmaps for textiles, electronics, and batteries, and continues as CIRPASS-2 with live pilots (https://cirpassproject.eu). For planning purposes the useful complement is DPP4All, an Austrian research report that sets out the data-exchange conditions and the legal and technical prerequisites a passport implementation actually has to satisfy, across textile, electronics, and battery use cases (Austrian BMK, St. Pölten UAS and Brainbows, 2023). For SMEs specifically, the Swedish Trace4Value programme, run with RISE, publishes a public DPP guide and documented cases including Filippa K, written for companies without a data department (https://trace4value.se).
The commercial layer is already operating ahead of the legislation. EON provides enterprise digital IDs, giving every item a cloud profile that accumulates lifecycle events from production through resale and recycling, deployed by H&M, Balenciaga, Zalando, and Chloé, and selected for the CIRPASS-2 DPP pilot (https://www.eon.xyz); Stella McCartney's implementation is among the most complete, with each garment carrying materials, manufacturing location, and certifications. Renoon reports more than ten million passport-ready products and over thirty live cases, and supplies the passport backbone behind Copenhagen Fashion Week's sustainability requirements (https://www.renoon.com). The practical reading for a design engineer is that the passport is no longer a research question but a procurement one.
6.2.4 Digital Traceability Platforms, Not Standards
The DPP does not require brands to build infrastructure, it requires them to connect to it. Traceability platforms centralize supplier data across tiers, fiber, spinning, weaving, dyeing, finishing, linking each production step to an item or batch. TrusTrace is representative of the category: it consolidates primary supplier data across all tiers for fashion, footwear, and textiles, uses it to map supply chains and manage due-diligence risk, and is built for volumes at which manual collection is not an option (https://trustrace.com). Circular-economy platforms such as Circular.fashion add design-for-recycling information to the same record. The division of labor is worth stating plainly: the passport is the customer-facing record, the platform is where the data is collected, cleaned, and verified before it gets there.
6.2.5 AI for Supplier Risk and Compliance Monitoring
AI on traceability data monitors what a spreadsheet cannot: anomaly detection flags inconsistencies between declared volumes, stated capacities, and order books; document verification checks certificates such as GOTS, OCS, and OEKO-TEX against issuer registers; ESG screening surfaces red flags before a supplier is onboarded. The output is a risk signal per supplier, which is the raw material for CSRD and CSDDD due-diligence reporting. Screening of this kind depends on knowing which facilities exist and who sources from them, which is the gap Open Supply Hub fills: a free, open database of production facilities worldwide, linking factories to the brands and suppliers that use them, usable both to locate sites in one's own chain and to check what else is known about them (https://opensupplyhub.org).
← PreviousNext: 6.3 Advanced Sorting and Textile Recycling Technologies →
6.3 Advanced Sorting and Textile Recycling Technologies
Traceability earns its keep at end-of-life. Sorting is the gatekeeper of recycling, and recycling technology dictates what sorting must deliver: a process that needs mono-material cotton at 99% purity imposes a sorting requirement that no manual line can meet, while a process tolerant of blends changes what is worth collecting in the first place. This section reviews both layers, the sensing technologies that separate the stream and the recycling routes that consume it, and the European scale-up now under way.
6.3.1 Sorting Decides Value: NIR Recognition and Textile Recycling
Sorting decides value. Manual sorting, still dominant, separates garments by reuse grade, material, color and pattern; it is flexible but labor-intensive and cannot verify fiber content. Automated sorting uses near-infrared (NIR) spectroscopy and hyperspectral imaging to identify materials from their spectral fingerprint, with color cameras for color streams; hyperspectral systems scan larger areas than point-NIR and handle patterned textiles better. Physics imposes limits: NIR reads only the surface (multilayer fabrics and elastane-core yarns are misread), dark shades absorb the signal, and blends visually resemble mono-materials, which is why the DPP's verified composition data (section 6.2) and RFID identification (6.2) are sorting technologies as much as data policies. Downstream, three recycling routes have different appetites. Mechanical recycling (shredding, tearing, re-spinning) is mature and low-cost, works for cotton and polyester, but degrades fiber length, only 5–20% of cotton input becomes spinnable fiber, and removes no dyes or chemicals: mostly downcycling. Thermo-mechanical recycling re-melts thermoplastics (PET, PA, PP) into granules, but molar mass falls with each cycle and virgin polymer must be blended in. Chemical recycling either dissolves polymers selectively (separating polyester from cotton) or depolymerizes them, PET back to PTA and MEG monomers, PA6 to caprolactam, enabling true fiber-to-fiber loops at virgin quality, at the price of high energy and capital costs and a demand for clean, well-sorted, mono-material feedstock. Elastane at even 3–5% blocks both mechanical and chemical routes; laminates, membranes and mixed trims block disassembly. The loop therefore closes only end-to-end: ecodesign (mono-materials, detachable components, Ch. 1.3) → identification (6.2) → verified data (6.2) → automated sorting → matched recycling route.
The loop therefore closes only end-to-end: ecodesign (mono-materials, detachable components, Ch. 1.3) → identification (6.2) → verified data (6.2) → automated sorting → matched recycling route.
The world's first fully automated textile sorting plant, SIPTex in Malmö, built by Stadler with TOMRA NIR technology, sorts up to 24,000 tonnes per year by fiber and color. Valvan's Fibersort line sorts around 2,000 garments per hour, discriminating fourteen fiber types including wool, cotton, viscose, polyester, and their blends, which is precisely the resolution a chemical recycler needs to accept a batch without re-testing it; the Global Fashion Agenda documented the system in its Textile Recycling Toolbox (2020) as the point at which sorting stops being a manual bottleneck and becomes a data-producing industrial step (https://globalfashionagenda.org/wp-content/uploads/2022/12/GFA_2020_TEXTILE_RECYCLING_TOOLBOX_3.0.pdf). ANDRITZ and Newretex are delivering comparable lines across Europe. On the recycling side, Circulose, restarted after Renewcell's 2024 insolvency, operates the first commercial-scale textile-to-textile plant for cellulosics at 60,000 t/year, with fabrics used by Ganni, Levi's, H&M, and COS; Infinited Fiber Company produces Infinna™ from cotton-rich waste with backing from H&M Group and Inditex; and Syre targets three million tonnes per year of textile-to-textile recycled polyester by 2032.
The bottleneck is therefore no longer chemistry. It is feedstock: collection and sorting capacity, garments designed to be recyclable at all, and the more prosaic problem of a mill not knowing which recycler will take its waste. That last gap is what the Global Fashion Agenda's Circular Fashion Partnership addresses in Bangladesh, where a shared data portal maps post-industrial textile waste flows alongside the sorters and recyclers able to process them, turning an informal scrap trade in one of the world's largest garment hubs into a sourcing decision that can be made on data (https://globalfashionagenda.org/circular-fashion-partnership/). Matching supply to capacity is an information problem, and it is the same one this course opened with in Chapter 1.
6.3.2 Case example: Rifò lab, regenerated wool in Prato
Rifò[38], founded in Prato in 2017 by Niccolò Cipriani, shows the mature end of the recycling spectrum built on the district's century-old know-how. Its knitwear is made from regenerated wool, cashmere, cotton and denim recovered from textile scraps and from garments taken back from customers: the feedstock is sorted by color so that no re-dyeing is needed, then mechanically shredded, pulled back into fiber and re-spun into new yarn using the traditional Prato cardato rigenerato process, with the entire supply chain kept within roughly a 30 km radius. The take-back scheme closes the loop and, crucially, makes it traceable: garments are collected, sorted and regenerated inside the Prato district rather than sent to generic disposal, and the regenerated pieces can themselves be recycled two or three times more.
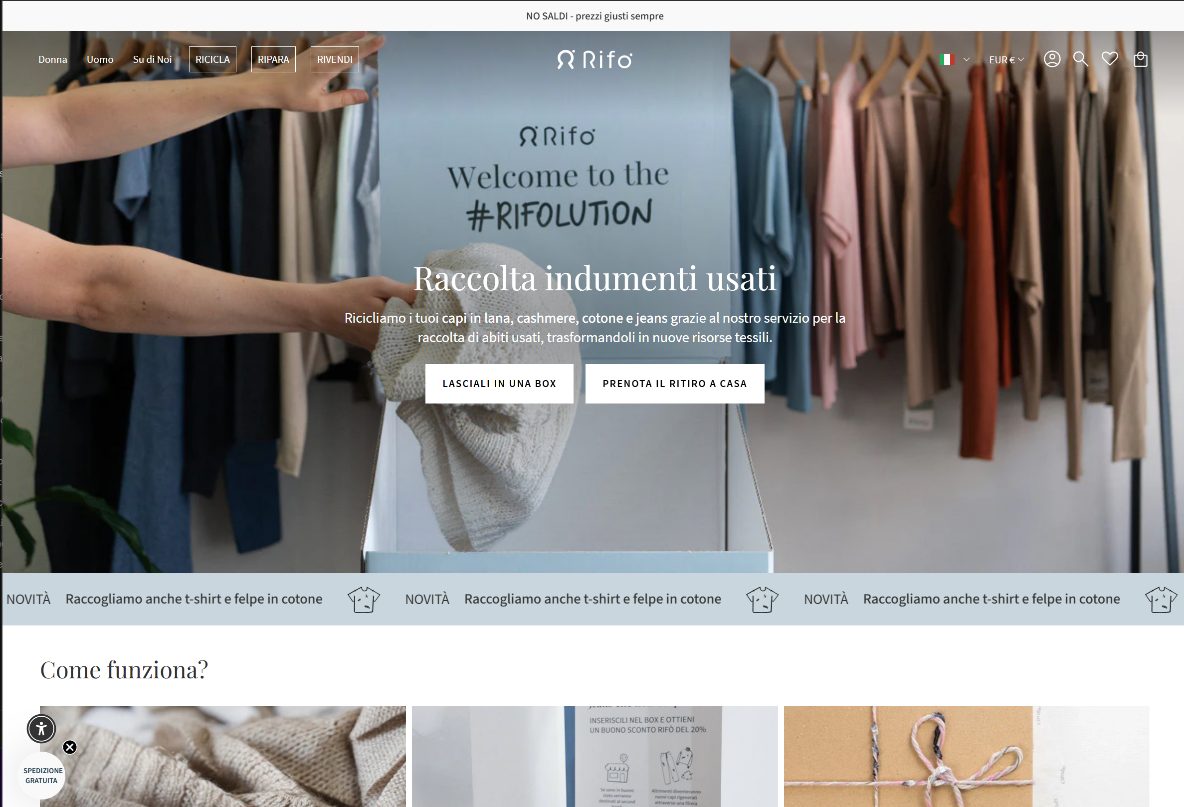
Figure 6.3, Rifò: regenerated cashmere and wool from customer take-back, produced within the Prato textile district. (Source: rifo-lab.com)
Recognized as a good practice on the EU Circular Economy Stakeholder Platform, Rifò is a working demonstration of decades-old Italian industrial circularity, the same tradition that today's sorting sensors and Digital Product Passport data will extend to fibers far harder to regenerate than wool.
6.3.3 Case example: Precious Plastic, open-source recycling machinery
Precious Plastic began as Dave Hakkens's graduation project at Design Academy Eindhoven and became a Dutch non-profit distributing the designs for a complete small-scale plastics recycling workshop: a shredder that reduces waste to flakes, extrusion and injection machines, and a sheetpress that compresses flakes into panels for furniture, tiles, and cladding. Every blueprint, tutorial, and business plan is published free, and the community platform and marketplace connect the people who build the machines with those who buy what comes out of them. The reported network stands at roughly 1,100 workspaces across 56 countries, processing on the order of 1,400 tonnes of plastic a year.
The relevance to this chapter is not the fiber but the architecture. Everything else in section 6.3 describes capital-intensive centralized infrastructure, a sorting plant that needs 24,000 tonnes a year to pay for itself, a depolymerization line that needs clean mono-material feedstock delivered at industrial volumes. Precious Plastic demonstrates the opposite topology: a recycling capability whose unit is a room, whose intellectual property is a free file, and whose economics work at the scale of a neighborhood. Distributed recycling does not compete with the industrial routes, it addresses what those routes will never collect, the small, contaminated, geographically scattered fraction that is uneconomic to transport. For a design engineer in the textile field the transferable questions are the same three: what can be recycled with machines a workshop can build, what output has value locally, and what has to be designed into the product for either to be possible.
6.4 Digital Circular Business Models: Rental, Resale, Upcycling at Scale
Technology closes the loop physically; business models close it economically. A garment that can be identified, authenticated, and graded is technically recoverable, but it re-enters use only if someone can make money moving it there. This section maps the circular models that digital platforms have made scalable, resale, rental, repair, and the redistribution of unsold stock, and the evidence on how fast they are actually growing.
6.4.1 Keeping Value in Use: Digital Circular Business Models
Circular business models keep value in use instead of extracting it once at the point of sale. The family is small and well defined: resale, both peer-to-peer and brand-operated, rental and subscription access, repair and refurbishment, and the redistribution of deadstock and excess inventory. Digital infrastructure is what moved all of these from boutique to scale. Item-level identification and DPP data supply authentication, condition, and composition, cutting the transaction costs that historically kept second-hand marginal; AI pricing and image recognition make listing an item nearly free; and platform logistics aggregate a supply that is, by nature, one item at a time. The critical questions belong in the same breath: rebound effects, whether cheap resale funds more first-hand consumption, the export of unsold second-hand volumes to the Global South, and the risk that circular services remain a marketing layer over a linear core. The honest metric is displacement. A circular model is sustainable to the degree that it replaces new production rather than adding to it.
Try it now
estimate the footprint of one garment with a free AI-assisted footprint tool (see 6.1.5) or, if you prefer no software, draft the DPP mock-up template provided in section 6.2.
Market evidence (2025–2026).
The global second-hand apparel market is estimated at around $390 billion, roughly 10% of total apparel spend, and is projected to grow about twice as fast as the wider fashion market over the next five years. The Global Fashion Agenda's Fashion CEO Agenda 2025 identifies digitally enabled circular models as one of the industry's fastest-growing segments, citing US second-hand growth of 14% in 2024, five times the rate of broader retail clothing, and attributing part of the acceleration to AI tools that make second-hand shopping as easy to navigate as a new-goods catalog (https://globalfashionagenda.org). The 2025 figures point the same way: ThredUp's 2026 Resale Report names AI-driven discovery as the growth engine, with Gen Z and Millennials driving about 70% of growth through 2030 and 60% of consumers now factoring resale value into new purchases, while brand-operated loops such as Zara Pre-Owned and Lululemon Like New integrate trade-in with store credit. Vinted leads European peer-to-peer resale; ThredUp reported 2025 revenue of $310.8M, up 20% year on year, with its first positive annual cash flow. For an SME, the accessible entry point is not building a platform but attaching resale or rental to product IDs that already exist (section 6.2).
6.4.2 Case example: MUD Jeans, Lease A Jeans and ReLoved

Figure 6.4, MUD ReLoved resale platform: pre-owned MUD Jeans are resold and kept in use as part of the brand's Repair–Rewear–Recycle system. (Source: mudjeans.eu)
The evolution of the model is itself instructive. MUD Jeans has since stopped offering new lease subscriptions (existing contracts run until June 2027): a decade of experience showed that most customers preferred to buy their jeans outright, and access-based rental, however elegant on paper, did not match how people actually wear denim. The brand did not abandon circularity; it redistributed it across simpler loops, "Repair. Rewear. Recycle.", including MUD ReLoved, a resale platform through which pre-owned pairs find a second owner and stay in use for longer. The lesson for this module is twofold: a circular business model survives only if it fits real consumption behavior, and a circular strategy is best understood as a portfolio of loops, repair, resale, recycling, that a company rebalances as evidence accumulates (MUD Jeans, mudjeans.eu).
6.4.3 The Tech Stack That Enables Circular Models
Circular models run on standard e-commerce infrastructure with three additions: resale and rental platform backends (catalogues, condition grading, owner transfer, subscription billing) exposed through APIs; item-level IDs (RFID, QR, woven labels) that tie each physical item to its digital record; and logistics integration, collection, inspection, cleaning, redelivery, so the loop is operated like a supply chain rather than a side project.
6.4.4 AI in Circular Commerce
AI is the pricing and matching engine of recommerce. Pricing algorithms set resale value from condition, brand, and live market data; image recognition classifies incoming items and drafts their listings; matching and demand forecasting route each item to the channel where it will sell fastest, which is the forecasting problem of Chapter 5 applied to an assortment with far higher variance and a sample size of one per item. The same matching logic operates upstream of the consumer, on stock that was never sold at all: aloqia runs an AI platform that connects brands' excess and deadstock inventory with buyers across reuse, resale, recycling, and donation channels, working with clients including Nike, Ralph Lauren, and SHEIN, and reports having surfaced around one billion dollars of excess inventory with 92% of listed liabilities diverted from landfill (https://www.aloqia.com). With the ESPR ban on destroying unsold goods now in force, this is the market that regulation created: a brand that cannot destroy deadstock needs a buyer for it, and finding one is a matching problem.
6.4.5 Data Flows from Circular Models Back into Analytics
Returns, repairs and resales are not cost centres, they are data sources. Every return reveals fit or quality issues; every resale reveals residual value and real-use durability. Fed back into forecasting and design analytics, these flows improve next-season planning and inform the circular-design decisions taught in the Circular Design Strategies module: the loop closes twice, physically and in the data.