Chapter 5 — full chapter
| Site: | FashionKIC Learning Platform |
| Course: | Digital Tools and AI for Sustainable Fashion |
| Book: | Chapter 5 — full chapter |
| Printed by: | Guest user |
| Date: | Sunday, 1 November 2026, 3:20 AM |
5.1 Demand Forecasting
Overproduction is fashion's largest source of waste, and it is not a moral failure but an arithmetic one. A collection is committed to production months before the first customer sees it, against a forecast built from last season's figures, a buyer's judgment, and a margin of safety that always errs toward excess, because a stockout is visible and unsold stock is absorbed quietly into markdowns and disposal. Every unsold garment was once a number in a planning spreadsheet.
This section treats forecasting as an engineering problem rather than an act of intuition. It covers the data that feeds a model, from point-of-sale and e-commerce behavior to search trends, weather, and sensor-level inventory signals, the machine learning methods that convert those signals into size-level and store-level predictions, and the infrastructure required to keep them current. The environmental case is identical to the commercial one: a forecast error is measured in meters of fabric, and improving the forecast is the cheapest waste reduction available to a brand that still produces to stock.
5.1.1 From Guesswork to Signals: Data-Driven Demand Forecasting
Traditional clothing supply chains forecast demand based on historical sales, then protect themselves against their own errors with long lead times, high inventory buffers, and end-of-season discounting, with the destruction of unsold stock as the final safety valve, now banned in the EU (Regulation (EU) 2024/1781, ESPR). Data-driven supply chains attack the error itself. Machine-learning models ingest historical sales together with real-time signals, weather, social media trends, search data, store-level sell-through, economic indicators, and produce granular forecasts per style, size, color, and location. Reported impacts are substantial: 20–30% improvement in forecast accuracy and 15–25% reduction in unsold inventory, with 20–30% lower inventory holding costs from dynamic replenishment. The forecasting layer rests on an execution layer: RFID and IoT sensors give real-time visibility of materials and finished goods (inventory error rates fall from 15–25% to under 1%), and AI production scheduling aligns manufacturing with actual demand, cutting work-in-process by 15–25% and overproduction by 10–15%. The strategic end-point is the shift from forecast-driven to demand-driven models: the better the forecast and the shorter the lead time, the smaller the batch that must be committed before real demand is known, until, at the limit, production follows the order. Two caveats matter. First, "garbage in, garbage out": every model inherits the quality of its input data, and data cleaning is where most projects succeed or fail. Second, an Industry 5.0 reading (Breque, De Nul & Petridis, 2021) insists that algorithms support human planners rather than replace them: forecasts quantify uncertainty, but assortment and volume decisions embed ethical and strategic judgments, including the choice not to produce.
Try it now
Take the last 12 months of sell-through data for one product (even in a spreadsheet), compute a simple moving average, and compare it with what you actually sold. The gap is your forecast error, the starting point of Chapter 5.
5.1.2 Case example: Inditex / Zara, forecasting at chain speed
Inditex, the world's largest fashion retailer, built its model on demand signals long before "big data" had a name: store managers' qualitative feedback and near-real-time sell-through drive assortment decisions twice a week. Today a machine-learning layer turns that instinct into prediction. Its models combine RFID item-level sales, every garment is chipped and tracked in real time, with regional weather, search and social-media sentiment and store traffic to forecast demand down to the SKU–colour–size, precisely enough that two shops on the same street can carry different assortments. The forecast then drives the response: small initial batches are produced and tested in store, fast movers are replenished within days and laggards cancelled before stock piles up. The sustainability effect is structural rather than cosmetic, because volume is committed after demand evidence rather than before it, Zara marks down only about 15–20% of its range against an industry norm of 30–40%, curbing overproduction at the source. The mechanism is also well documented in the operations-research literature: Felipe Caro and Jérémie Gallien formalised Zara's inventory-allocation and clearance-pricing systems in Operations Research, reporting measurable gains over the retailer's earlier manual heuristics.

Figure 5.1, Zara (Inditex): the data-driven store, here the 'Shop the Look' augmented-reality window. (Source: Zara/Inditex)
fghf
5.2 Supply Chain Optimization
A forecast is a number; a supply chain is a sequence of commitments made under it. How much to order and from where, how much safety stock to carry, which units go to which store or fulfillment center, when to replenish and when to stop: each decision is taken with incomplete information and, traditionally, defended with buffers. Those buffers are the waste. Long lead times are absorbed by ordering early and in bulk, uncertainty is absorbed by holding excess stock, and the residue is cleared through markdowns and, until the EU banned the practice, destruction.
This section treats those decisions as a continuous optimization problem, combining machine learning forecasts with operations research and network simulation. The environmental argument is that tighter matching removes the need for the buffers rather than disposing of their consequences, and that the same precision is what makes the small-batch and on-demand models of Chapter 4 economically viable.
5.2.1 From Forecast to Flow: Optimizing Sourcing, Allocation and Replenishment
Where forecasting produces a number, optimization turns that number into decisions: how much to order and when, how much safety stock to hold, how to allocate limited units across stores and channels, and how to route and replenish them. Data-driven supply chains treat this as a continuous optimization problem, combining machine-learning forecasts with operations-research methods and, increasingly, digital twins that simulate the whole network before committing real inventory. The goal is to match supply to demand tightly enough that the classic defenses of the fashion supply chain, long lead times, high safety stock and end-of-season markdowns, with destruction of unsold goods as the final valve, now banned in the EU under Regulation (EU) 2024/1781 (ESPR), are no longer needed. The sustainability payoff is direct: less overproduction, fewer returns and shorter lead times, which in turn make the small-batch, on-demand models of Chapter 4 economically viable.
5.2.2 Case example: Zalando, machine-learning allocation and returns optimization
Zalando[28], Europe's largest fashion platform, shows supply-chain optimization on the demand-facing side of the network. Machine-learning models allocate inventory across its fulfillment centers and pre-position stock close to where demand is expected, cutting delivery time and last-mile cost; unusually, they also fold returns directly into the optimization, accounting for items already in processing, returns in transit, and products statistically likely to be sent back, so each warehouse is stocked against its real available inventory rather than its nominal one. Because returns are the defining waste of online fashion, every rejected parcel means duplicate shipping, handling and often markdown or disposal, Zalando attacks the problem upstream too, with AI size-and-fit tools and a 3D virtual fitting room: it reports that in 2025 these prevented roughly 8% of size-related returns overall, with the fitting room cutting returns by up to 40% where used. The case makes the sustainability logic of optimization explicit: matching supply to demand tightly and preventing returns before they happen remove emissions and waste that no downstream recycling can recover (Zalando, 2025).

Figure 5.2, Zalando's AI size-and-fit tool: phone-based body measurements drive size recommendations that cut returns. (Source: zalando.com)
fgt
5.3 Data-Driven Material Choice
Material selection is the single most impactful design decision (up to 80% of the impact is locked in at design), and it is increasingly made using databases rather than intuition. This section connects fiber impact profiles, material databases, and the market data that frames them.
5.3.1 Beyond the Single Number: Data-Driven Material Choice
Every fiber family has a structured impact profile, and single-parameter comparisons mislead. Conventional cotton: renewable and biodegradable, but high water footprint and pesticide use. Polyester: fossil-based and a microplastic source, but low water footprint, high durability, and, per single use, potentially lower impact than a fragile natural-fiber garment. Man-made cellulosics (viscose, modal, lyocell): performance depends almost entirely on the production system, closed-loop lyocell (e.g. TENCEL™[25]) with solvent recovery differs radically from conventional viscose. Recycled polyester (rPET) requires 30–50% less energy than virgin polymer, but 98% of it still comes from PET bottles rather than textiles, which merely delays, not closes, the loop. The engineering discipline is to compare materials per functional unit, including the use phase: a 3 kg CO₂e T-shirt worn 10 times costs 0.30 kg CO₂e per wear; a 3.5 kg CO₂e T-shirt worn 50 times costs 0.07 kg CO₂e per wear, the "worse" material on the label is four times better in use. Digital tools industrialize this reasoning: LCA-based material indices aggregate cradle-to-gate impacts per material and process; chemical databases (e.g. ZDHC Gateway[20]) manage restricted substances; and DPP composition data will feed the same indices with product-specific rather than average values. The critical caveat inherited from section 6.1 applies with full force: material indices embed methodological choices (boundaries, allocation, data vintage), and comparing scores across methodologies is invalid.
The market frame (Textile Exchange[15], Materials Market Report 2025): global fiber production reached a record 132 million tonnes in 2024 (up from 125 Mt in 2023) and is projected to reach ~169 Mt by 2030 under business-as-usual. Polyester alone accounts for 59% of output (88% of it fossil-based); recycled fibers overall are 7.6%; recycled polyester's share of polyester slipped to 12%; and less than 1% of the global fiber market comes from pre- and post-consumer recycled textiles. Data-driven material choice therefore operates against a market still moving in the opposite direction (Textile Exchange, 2025).
5.3.2 Case example: Higg MSI / Cascale, a shared material database
The Higg Materials Sustainability Index (MSI), developed by Cascale (formerly the Sustainable Apparel Coalition) and hosted on the Worldly platform, is the industry's most widely used cradle-to-gate material scoring framework, built on peer-reviewed LCA data and used by tens of thousands of organisations. Version 3.11 (November 2025) added new cotton datasets and expanded material categories.
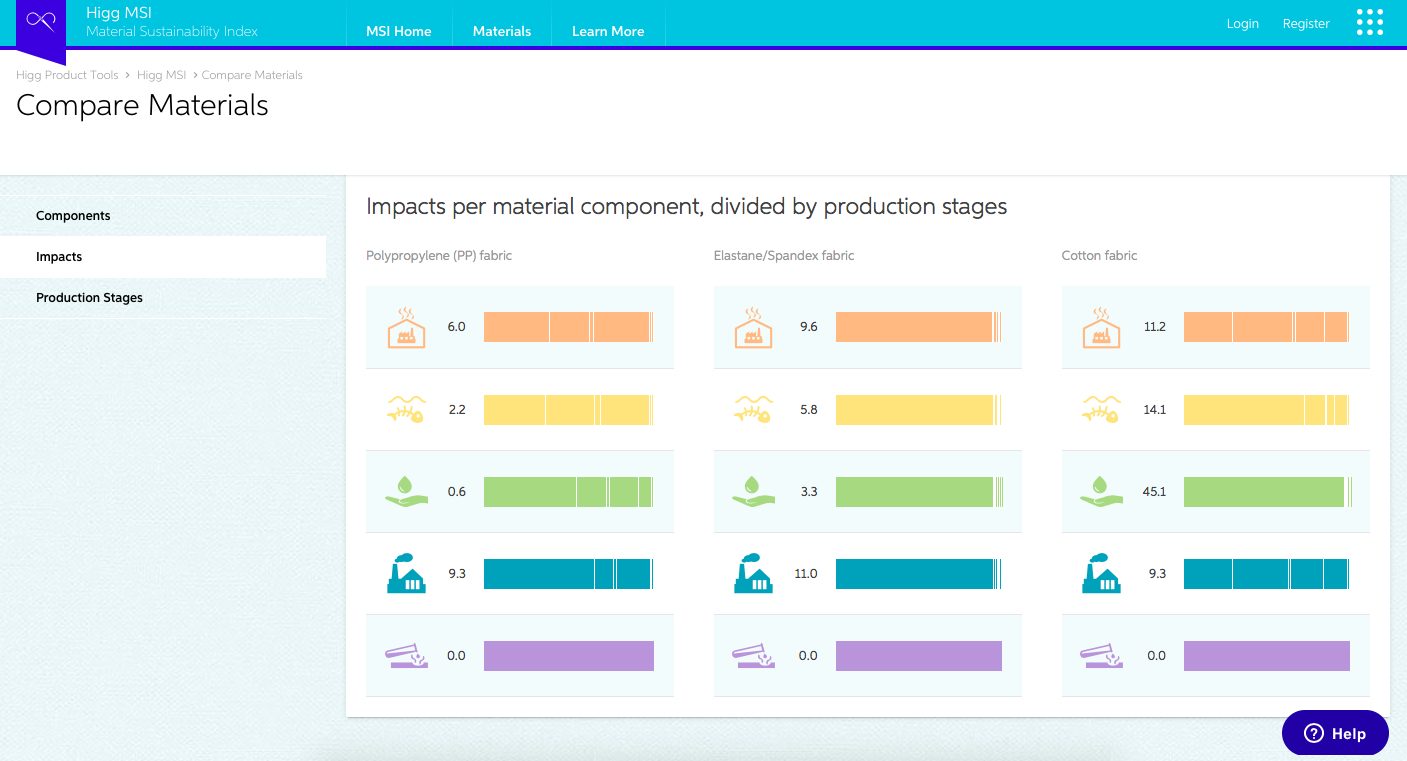
Figure 5.3, Higg MSI 'Compare Materials': environmental impact of PP, elastane and cotton, broken down by production stage. (Source: Higg MSI / Cascale)
Its history is also a methodology lesson: criticism of its data vintage and normalization choices, which led to a temporary suspension of consumer-facing use in 2022 and an independent review, demonstrates exactly the principle of section 6.1: an index is only as credible as the transparency of its method (Cascale, 2025; Worldly, 2024).
5.4 AI/ML for Sustainability Reporting
Sustainability disclosure used to be written by a communications team and read as a narrative. Under the CSRD and the ESPR it is a filing: structured, product-level, auditable, and produced on a schedule. A brand with tens of thousands of SKUs cannot assemble that by hand, which is why the same data infrastructure built for forecasting and sourcing is now pointed at accountability, matching bills of material to emission factors, filling gaps, and computing footprints per product rather than per company.
This section covers how those pipelines are built and where they break. Automation makes measurement continuous and cheap enough to publish, but it does not make it true: a footprint inherits the quality of its inputs, and an estimate presented with the confidence of a measurement is the shortest path from a reporting obligation to a greenwashing claim.
5.4.1 From Data to Disclosure: Machine Learning for KPIs and Reporting
Regulation is turning sustainability from a marketing narrative into a reporting obligation: the Corporate Sustainability Reporting Directive (CSRD), the ESPR and its Digital Product Passport all demand structured, auditable, product-level environmental data. Producing that data by hand is infeasible at catalog scale, so machine learning is increasingly used to automate it, matching bill-of-materials and supplier data to emission-factor databases, estimating missing values, computing footprints and KPIs per SKU, and feeding dashboards and regulatory filings. This is the data-and-ML complement to the life-cycle assessment methodology of Chapter 6: LCA defines what to measure and how, while these pipelines make the measurement continuous, comparable, and cheap enough to publish. The central risk is data quality, a footprint is only as credible as its inputs and factors, which is why defensible reporting depends on transparent methods and traceable primary data rather than convenient estimates, and why weak data is the fastest route to a greenwashing claim.
5.4.2 Case example: Carbonfact and Vaayu, product-level environmental data at scale
Paris-based Carbonfact provides carbon-management and environmental-data software that lets apparel, luxury and footwear brands measure, report and reduce emissions and comply with regulation; by 2026 it served more than 200 brands. In 2026 it acquired Berlin-based Vaayu, an AI-powered product-impact platform founded by a former Zalando sustainability executive, to build what the merged company calls fashion's largest environmental dataset: over 150,000 fashion-specific emission factors, 650+ material categories and data from thousands of textile factories, aimed squarely at CSRD, ESPR and Digital Product Passport requirements. The case shows the reporting pipeline in practice: machine learning turns fragmented supply-chain data into product-level footprints defensible enough to disclose (Carbonfact; ESG Today, 2026).
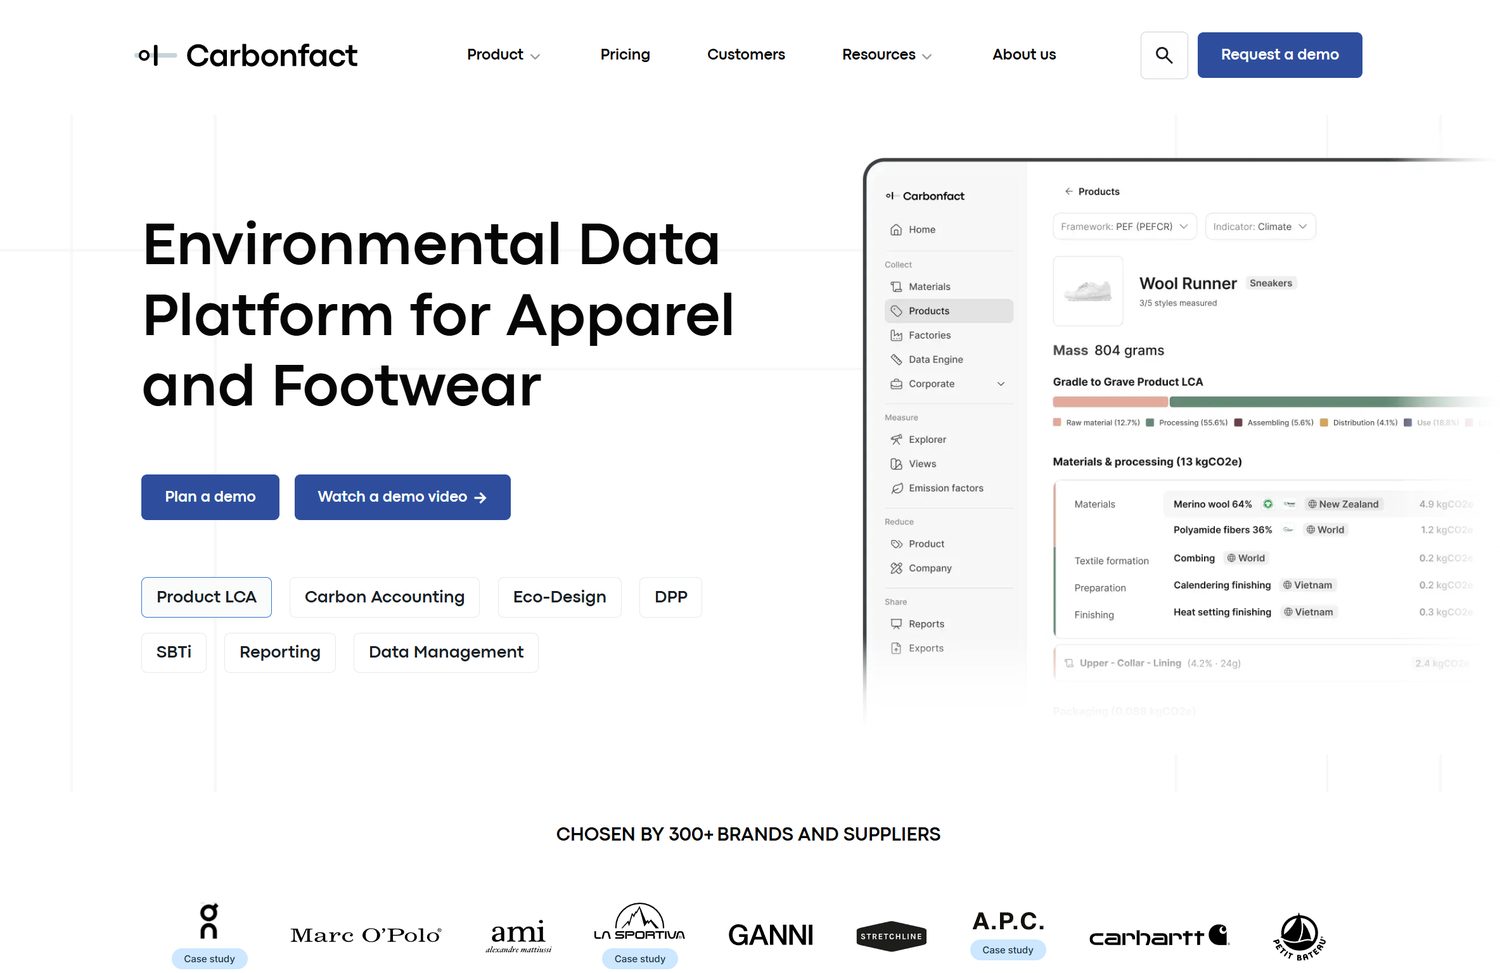
Figure 5.4, Carbonfact's environmental-data platform: a cradle-to-grave product LCA (here a wool sneaker) with impact broken down by material and stage. (Source: carbonfact.com)